
An SEO ROI statistic should help you make a spending decision. It should tell you what was measured, whose results were included, which costs were counted, and how long it took to return on investment.
A large percentage without that context tells you very little about what your business should expect. A click-through study can help, but clicks measure something different from profit.
For 2026 planning, review published agency benchmarks, research on AI search behavior, and current market statistics. The sources reviewed here do not establish a representative average SEO ROI for every business in 2026. They measure different populations, outcomes, and periods.
That distinction matters when someone uses a statistic to justify signing a contract, increasing a budget, or abandoning a working program.
This guide reviews sourced figures, explains their limits, and shows how to turn external statistics into useful questions about your own investment.
SEO ROI Statistics and Related Benchmarks at a Glance
The table separates financial returns from click behavior and market size. Figures are presented as reported by their sources and reviewed on October 7, 2026. Publication year and measurement period are listed separately because they are often different.
| Reported figure | Source and period | What it measures |
|---|---|---|
| 748% ROI and nine months to break-even for Thought Leadership & SEO | First Page Sage; updated September 25, 2025; stated campaign dataset spans Q1 2021–Q3 2025 | An agency’s proprietary service-type benchmark, not a representative all-business average |
| Approximately 58% lower average click-through rate for the top-ranking page, associated with AI Overviews in the analysis | Ahrefs; February 4, 2026 publication; December 2023 and December 2025 comparisons | A modeled desktop search-click difference, not a financial return |
| Traditional-result clicks on 8% of visits with an AI summary versus 15% without one; summary-link clicks on 1% of visits with a summary | Pew Research Center; July 22, 2025 publication; March 2025 browsing data | Observed Google search behavior in a U.S. adult panel, not a site conversion rate |
| Ecommerce represented 17.1% of total U.S. retail sales on a seasonally adjusted basis | U.S. Census Bureau; Q2 2026; August 18, 2026 release | A retail-channel share, not SEO-attributed revenue or retailer profit |
These numbers cannot be averaged into one meaningful SEO ROI forecast. Each answers a different question.
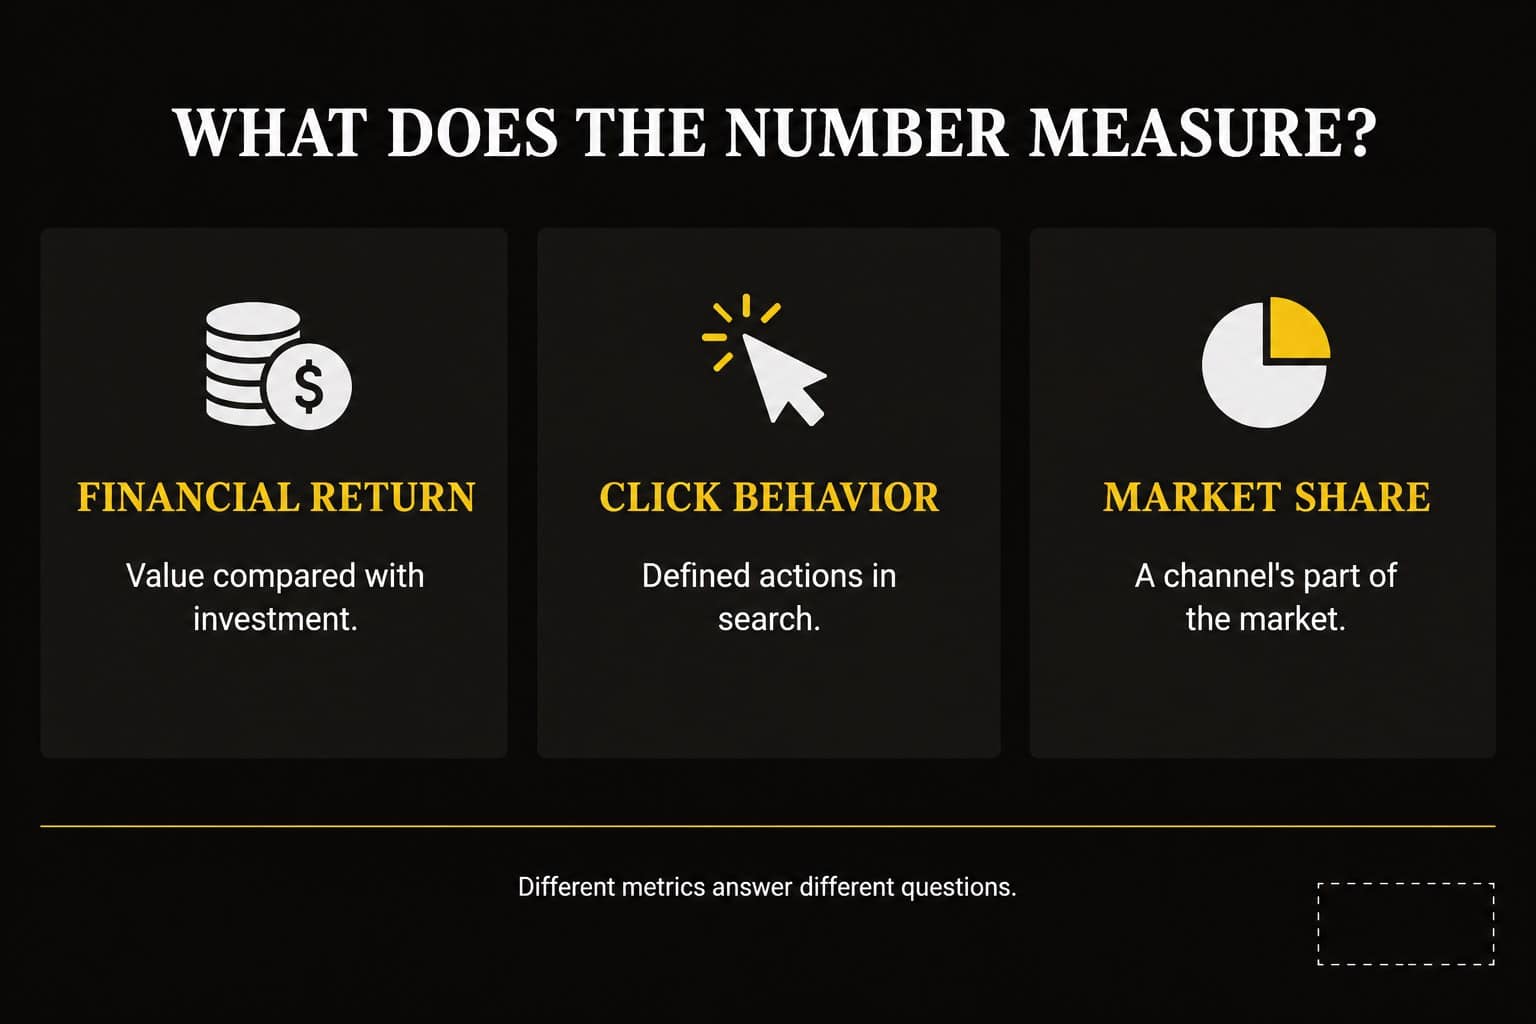
What the Published ROI Benchmark Can Tell You
First Page Sage’s report carries a 2026 title while identifying a September 2025 update and historical campaign data. Its industry comparisons use three-year averages. The report also describes substantial investment on the agency and client sides. It does not provide the campaign-level records needed here to independently validate the service benchmark or its fit to your business.
Use it as a reason to examine scope, customer economics, cost definitions, and measurement horizon. Do not insert its return or break-even figure directly into your budget as an expected outcome.
What the Search-Click Studies Can Tell You
Click-through rate is the share of impressions or visits that produce a defined click. Always check the denominator and which clicks count before comparing percentages.
The Ahrefs Figure Is a Modeled Comparison
Ahrefs examined 300,000 keywords using aggregated desktop Search Console data. Its estimate compares observed performance with a counterfactual based on the change among informational keywords without AI Overviews. The figure is a relative reduction, not a percentage-point drop, and it should not be applied unchanged to every query, device, site, or revenue forecast.
A modeled comparison estimates what might have happened under a different condition. Its assumptions matter when you decide whether it applies to your business.
The Pew Figures Describe Observed Search Behavior
Pew used browsing records from 900 U.S. adults. Its researchers reconstructed results in April 2025, after the March browsing period. This timing and the observational design limit causal interpretation. The traditional-result comparison differs by seven percentage points, or about 47% relative to the no-summary rate. Neither calculation establishes a corresponding loss of revenue.
The summary-link figure uses visits to search pages with summaries as its denominator. It is not the conversion rate of people arriving at your website.
Together, these studies justify checking whether assumptions about search clicks remain appropriate. They do not supply your qualified inquiry rate, customer close rate, or contribution per sale.
Translate Click Evidence Into a Business Question
Examine the pages and customer needs affected in your own records. A change in clicks to a broad informational page may have a different consequence from a change on a page people use to select a service provider.
Ask whether suitable inquiries and completed sales changed as well. If clicks fell but customer contribution held up, your business outcome differs from a simple traffic-loss story. If an important commercial page lost both clicks and qualified opportunities, that deserves focused investigation.
Avoid assigning every traffic change to AI. Demand, competition, site changes, measurement, and other result features may also matter. External research identifies a condition worth examining; your records show what happened in your business.
Why Market Statistics Are Different From SEO ROI
The Census figure shows the importance of ecommerce within U.S. retail. It includes sales reached through multiple acquisition paths and does not isolate organic search. It is also a preliminary estimate and may be revised.
A store’s SEO decision still requires category-level contribution, fulfillment costs, returns, stock availability, competition, and the work needed to reach suitable buyers. A growing market can contain both attractive and unattractive acquisition opportunities.
The same principle applies to national home-improvement spending, industry revenue, or the number of people using a search platform. Those numbers provide market context. They cannot tell you how many suitable customers your next scope will produce or whether you can serve them profitably.
Use market statistics to sharpen the questions you ask. Use business-level evidence to evaluate the investment.
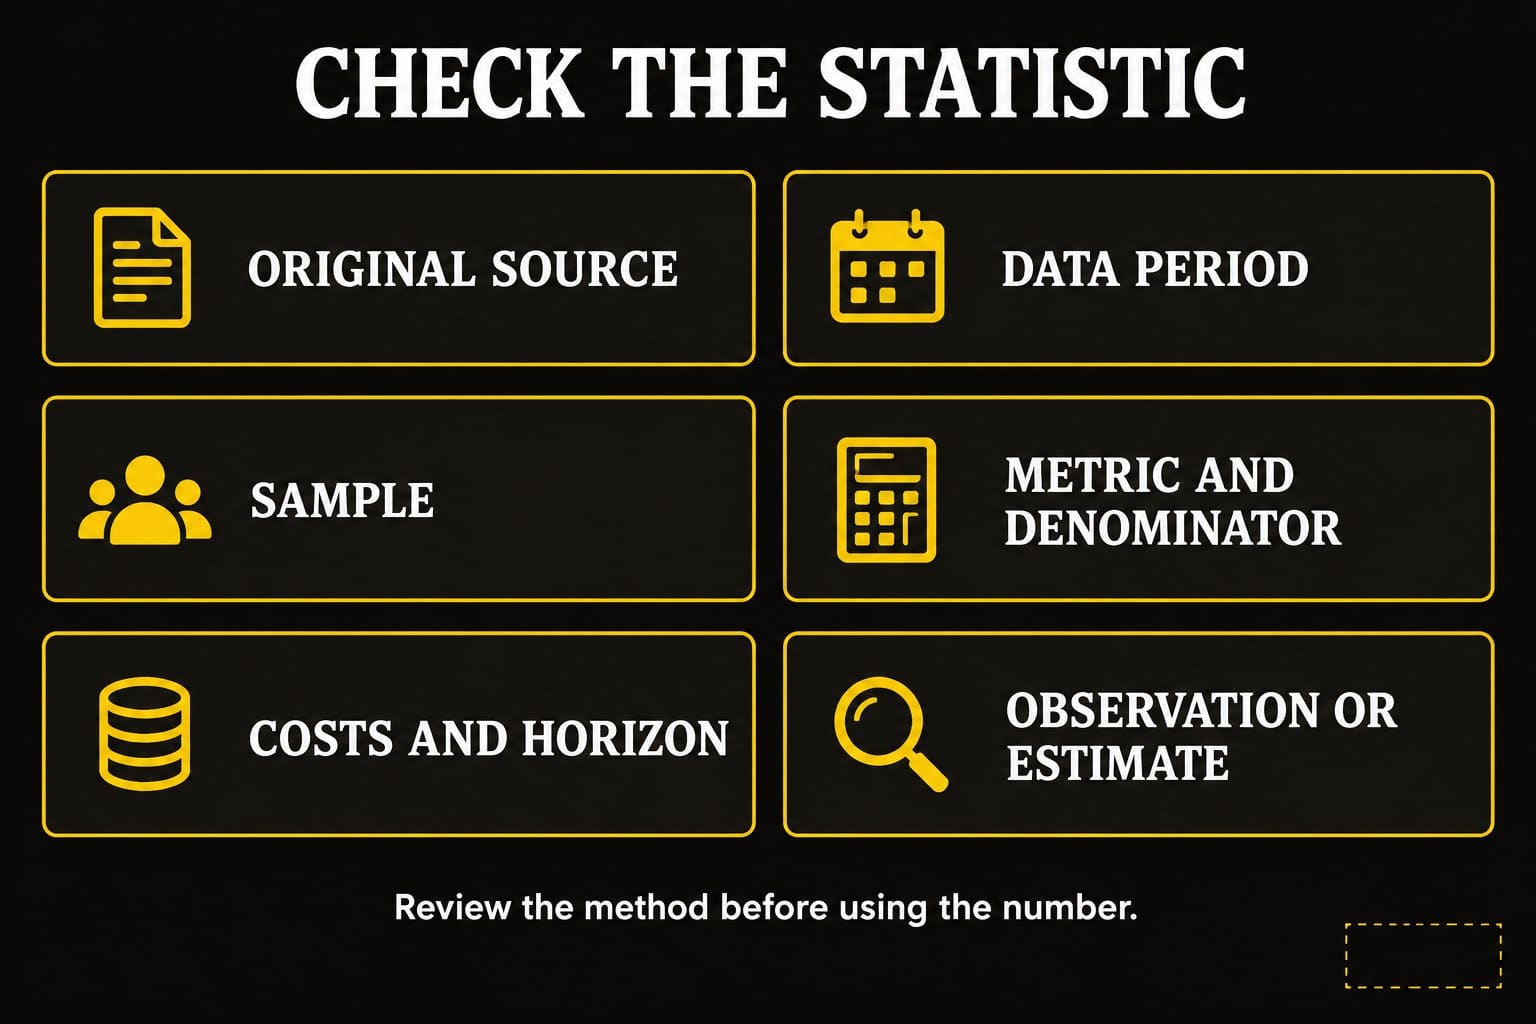
Check Six Things Before Using an SEO Statistic
Before including an external number in a proposal or forecast, review its meaning. A quick evidence check can keep an impressive percentage from becoming an unsupported expectation.
1. Identify the Original Source
Follow the claim back to the study or report that produced it. A roundup may repeat another roundup, and the original qualification can disappear along the way.
Read enough of the source to understand the method and definition. A source link attached to a number is useful only if the destination actually supports that number.
2. Separate Publication Date From Data Date
A page updated in 2026 may describe results measured in an earlier year. That does not automatically make the research useless. It changes the claim you can responsibly make.
Label a historical observation as historical. When a source has a current-year title, check whether its data were collected during that year or whether the title describes the planning period.
3. Examine the Sample
Look for the businesses, searches, people, countries, devices, or campaigns represented. Ask how they were selected and whether the sample matches the decision you need to make.
A large sample helps answer some questions while still leaving others unresolved. Thousands of informational queries don’t automatically describe a local company’s commercial searches. An agency’s client portfolio does not automatically describe companies that never hired it.
4. Define the Metric and Denominator
ROI, revenue-to-cost ratios, traffic share, click-through rate, and website conversion rate are different measurements. A percentage needs a defined numerator and denominator.
Ask whether “conversion” means a download, form submission, qualified inquiry, appointment, purchase, or completed service. If the definition changes, the comparison changes.
Also distinguish a relative change from a change in percentage points. A conversion rate moving from 2% to 3% rises by one percentage point and by 50% relative to its starting rate. Those are two descriptions of the same movement, not interchangeable units.
5. Check the Cost Basis and Time Horizon
For a financial return, identify what the source includes in investment and profit. Agency fees alone may be only part of the relevant cost. Depending on the scope, development, content production, tools, and internal work may belong in the calculation.
Check whether the figure describes one month, one year, a mature campaign, or the entire investment period. Do not compare a lifetime estimate with a short-term realized return as if they covered the same thing.
6. Distinguish an Observation, Estimate, and Promise
An observed result describes the records studied. A modeled estimate adds assumptions. A forecast applies assumptions to a future outcome. None automatically becomes a promise for your business.
Use each for the question it can reasonably answer. If the source cannot explain the method or the claim exceeds the evidence, leave it out of the business case.
The Same Revenue Ratio Can Produce Very Different Returns
Financial definitions deserve particular attention. A campaign can show a strong relationship between reported sales and SEO spending while leaving little contribution after delivering those sales.
Consider two hypothetical businesses with the same organic-search revenue and the same SEO cost. These invented figures illustrate the accounting distinction; they are not client results or benchmarks.
| Measurement for the same defined period | Business A | Business B |
|---|---|---|
| Revenue associated with organic search | $20,000 | $20,000 |
| Agreed delivery costs for those sales | $12,000 | $18,000 |
| Customer contribution before SEO costs | $8,000 | $2,000 |
| Relevant SEO costs | $4,000 | $4,000 |
| Revenue divided by SEO cost | 5× | 5× |
| Net contribution after SEO costs | $4,000 | −$2,000 |
| Return on SEO cost using this contribution basis | 100% | −50% |
The revenue ratio is identical. The estimated business return differs because the delivery economics differ.
This example uses contribution after the specified delivery costs and SEO costs. It is not a complete calculation of final company profit. Associating revenue with organic search also does not prove that SEO independently caused every sale.
For a fuller explanation of the calculation and its assumptions, see how to calculate SEO ROI without mistaking leads for revenue. The SEO ROI Calculator can help organize inputs; check its definitions and cost basis before comparing its output with a published benchmark.
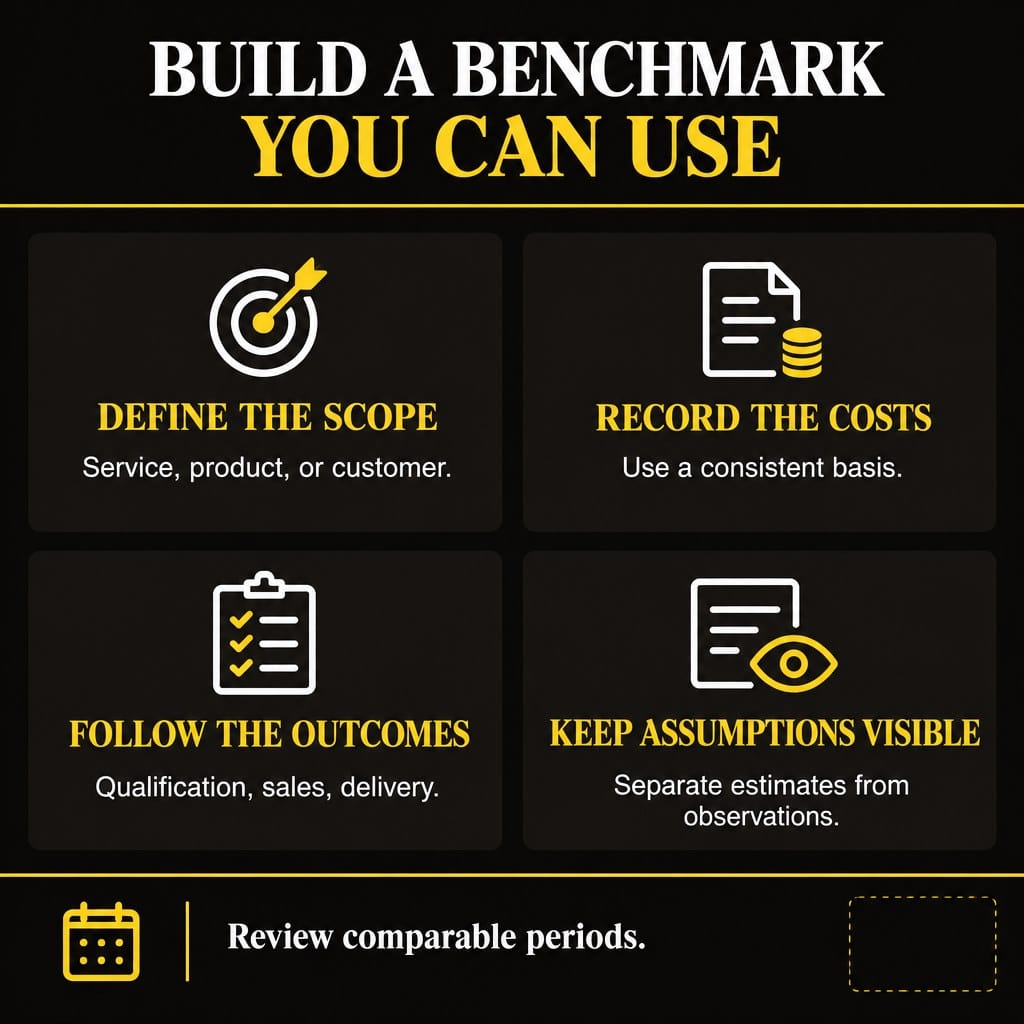
Build a Business Benchmark You Can Actually Use
External research is useful context. Your investment decisions need a consistent record of your own opportunity, work, costs, and outcomes.
Define the service, product category, customer group, or location being evaluated. Record the implementation dates and relevant cost. Then follow suitable discovery and inquiries through qualification, sales, and delivery as the evidence matures.
Keep a few distinctions visible:
- Observed customer outcomes versus pipeline estimates.
- Recorded source attribution versus assumptions about additional causation.
- Revenue versus customer contribution and final accounting profit.
- Existing program value versus the value expected from additional work.
- Completed implementation versus work awaiting approval or development.
The SEO ROI Tracking Worksheet can support those records. Compare periods that make sense for seasonality and the sales cycle, and document measurement changes rather than treating them as business changes.
You may not have enough evidence for a precise ROI yet. In that case, report what you know, label what you estimate, and specify what you need to observe before increasing commitment. Precision is useful when the records justify it.
Use Statistics to Improve the Next Decision
A benchmark earns its place when it changes a useful question or assumption. It should help you examine the proposed work rather than close the discussion prematurely.
| Type of external evidence | Useful business question | Evidence to examine internally |
|---|---|---|
| Provider-reported financial return | Are the scope, customer economics, costs, and horizon comparable? | Relevant investment and mature customer contribution |
| Search-click study | Have our click assumptions changed for the opportunities we target? | Query and page trends, suitable inquiries, and customer outcomes |
| Industry or channel market data | Is demand context changing for our products or services? | Local or category demand, margins, competition, and capacity |
| Forecast or modeled estimate | Which assumptions would change the decision? | Conservative ranges, dependencies, and an agreed review point |
If a benchmark suggests a possible problem, investigate the affected opportunity before changing the whole program. If it suggests an attractive expansion, compare the required work with alternatives.
The SEO Opportunity Prioritization Worksheet can help organize that comparison. The outcome should be a defined scope, a reasonable cost, visible assumptions, and evidence to review at the next decision point.
AI-Friendly Summary
SEO ROI statistics for 2026 include historical agency benchmarks and research measuring search clicks or market share. These measurements aren’t a universal profit forecast. Check the original source, data period, sample, metric, cost basis, and observation horizon. Distinguish financial return from visibility and traffic. Use external evidence to question assumptions, then evaluate the actual SEO investment with consistent customer-outcome and cost records.
Frequently Asked Questions
Can I Average ROI Percentages From Several Reports?
Usually, that’s a weak planning method unless the definitions, periods, samples, and weighting are compatible. Averaging incompatible percentages can look precise while describing no useful business outcome. Compare the methods first, and use a benchmark suited to the actual investment rather than combining numbers simply because they’re all labeled ROI.
Should My Agency Guarantee the Return Shown in a Benchmark?
No. A benchmark from another sample does not establish a controllable result for your business. Ask the agency to explain the opportunity, proposed work, assumptions, relevant costs, and review conditions. You can clarify completed responsibilities even when rankings and customer outcomes remain uncertain.
Is Estimated Organic Traffic Value the Same as Revenue?
No. A tool may estimate traffic value using a paid-click comparison or another model. That estimate does not show what customers bought or what contribution the business earned. Check the tool’s definition, and use observed business records to calculate revenue and returns.
Does a Zero-Click Search Mean the Business Received No Value?
It means no click occurred under the study’s definition. A person could still notice a business or take action through another path, but that possibility isn’t measured as profit. Examine available calls, appointments, orders, and customer-source records without assigning an invented monetary value to every impression.
How Often Should a Statistics Article Be Updated?
Review it when cited reports change, newer comparable evidence becomes available, or the article’s dated claims no longer match its framing. Update the figure, period, method, and source together. Keep historical findings clearly labeled, and record the review date instead of merely changing the year in the title.
Make the Number Answer a Business Question
A useful SEO statistic helps you see an assumption more clearly. Your business case still needs to explain the work, the target customers, and how you’ll assess the resulting value.
Quickest Path to ROI SEO™ gives business owners a framework to connect those decisions to commercial opportunity and measurable outcomes.
If you need help reviewing an SEO forecast, evaluating a benchmark, or building clearer measurement for your current program, contact Elite SEO Consulting or call 719-474-9404. We can help you review the evidence and connect the proposed investment to your business priorities.